Shrink Exercise: Growth Chart Resilience
May 6, 2018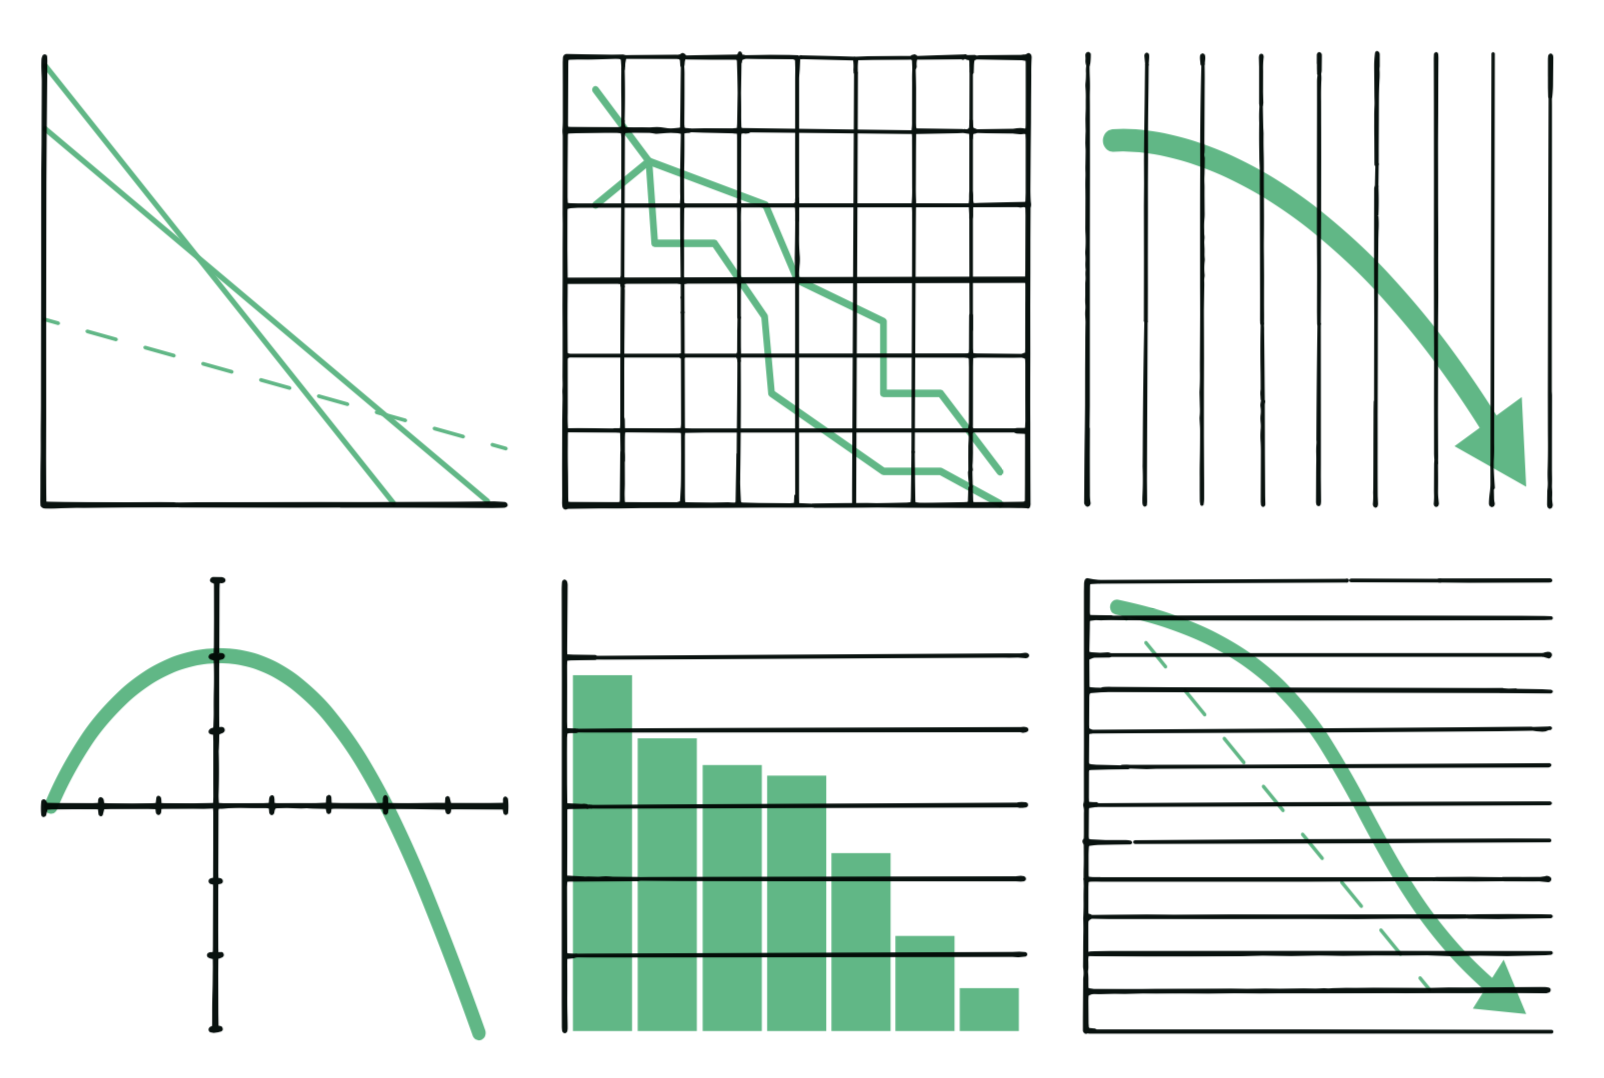
When we say that the human species is obsessed with growth we mean that even without specific context any decline or absence of growth mostly inspires a negative response. At the same time an increase creates a positive feeling. Through a series of simple exercises we intend to build resilience against our default response that growth is always good. In the Growth Chart Resilience Exercise we combine graphs that show the decline of a factor with the color green. In financial markets the color green usually represents growth and is used for graphs going up. Declining graphs are more often combined with the signalling color red. Our confused response in encountering a declining green line shows how deeply our positive connotations with the idea of growth have rooted. Perhaps by looking at graphs like this we can untangle some of these confused notions.
The paradox represented in the color green is that it symbolises qualities like life, renewal, harmony and environment as well as greed, money, growth, and jealousy. Rather than provide us with a clear illustration of our desire for less, the Growth Chart Resilience Exercise presents us with the challenge of having to reconcile seemingly disparate notions of growth and decline, as well as the different emotions inspired by the color green. The Growth Chart Exercise was first presented in the Rabobank head office in Utrecht.
Image by Jeroen van Kempen.